EU new truck registrations: data table for 27 countries
In 1–9 2026, new registrations of trucks over 3.5 tonnes in the 27 EU countries totalled 245079, up 7.5% year on year. The table below lists new registrations, year-on-year change, net increase and rechargeable trucks by country; click a column header to sort, or download the CSV. The 3D map on the home page uses the same data.
- Truck new registrations
- 245,079 units
- Net increase
- +17,166 units
- Rechargeable trucks
- 12,873 units
- Plug-in share
- 5.3%
YoY +7.5%
227,913 units in the same period of 2025
YoY +49.8%
Diesel trucks 91.7%
New truck registrations in the EU-27, 1–9 2026 (units)
Germany, France and Poland together account for 48.0% of EU new registrations. Of the 27 countries, 20 grew year on year and 7 declined; among countries with more than 3000 new registrations, Belgium posted the steepest drop (−6.1%). Bar length shows new registrations; year-on-year change is shown on the right.
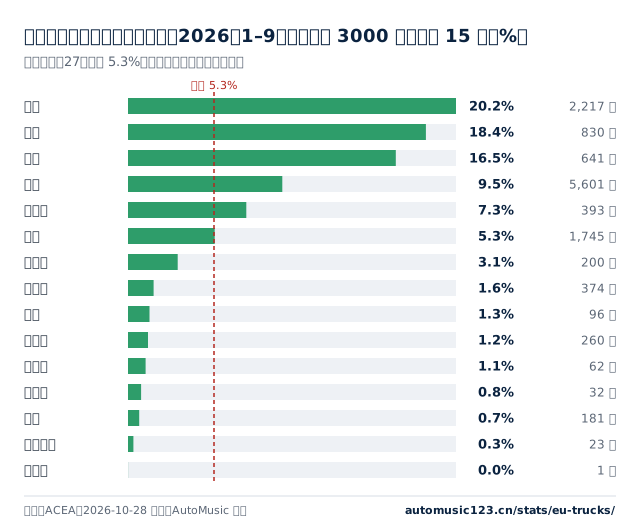
Rechargeable trucks as a share of new registrations, months 1–9 of 2026, 15 countries with more than 3000 new registrations (%)
The Netherlands has the highest share at 20.2%; 6 of 15 countries are above the EU overall share of 5.3% (vertical line). EU new registrations of electrically chargeable trucks totalled 12873 units, with Germany, France and the Netherlands together accounting for 74%. Countries with fewer than 3000 new registrations have small samples and are excluded from share comparisons; volumes are shown in the table below.
Country data tables
Download CSV ↓| GermanyGermany | 58,888 | 57,434 | +2.5% | +1,454 | 5,601 | 9.5% | 24.0% |
|---|---|---|---|---|---|---|---|
| FranceFrance | 32,674 | 33,221 | −1.6% | −547 | 1,745 | 5.3% | 13.3% |
| PolandPoland | 26,168 | 21,712 | +20.5% | +4,456 | 181 | 0.7% | 10.7% |
| SpainSpain | 23,696 | 20,928 | +13.2% | +2,768 | 374 | 1.6% | 9.7% |
| ItalyItaly | 21,101 | 20,679 | +2.0% | +422 | 260 | 1.2% | 8.6% |
| LithuaniaLithuania | 11,055 | 8,911 | +24.1% | +2,144 | 1 | 0.0% | 4.5% |
| NetherlandsNetherlands | 10,967 | 8,398 | +30.6% | +2,569 | 2,217 | 20.2% | 4.5% |
| Czech RepublicCzechia | 7,242 | 6,570 | +10.2% | +672 | 96 | 1.3% | 3.0% |
| RomaniaRomania | 6,851 | 6,087 | +12.6% | +764 | 23 | 0.3% | 2.8% |
| BelgiumBelgium | 6,523 | 6,950 | −6.1% | −427 | 200 | 3.1% | 2.7% |
| PortugalPortugal | 5,713 | 4,261 | +34.1% | +1,452 | 62 | 1.1% | 2.3% |
| AustriaAustria | 5,389 | 5,277 | +2.1% | +112 | 393 | 7.3% | 2.2% |
| SwedenSweden | 4,520 | 4,351 | +3.9% | +169 | 830 | 18.4% | 1.8% |
| HungaryHungary | 3,962 | 3,707 | +6.9% | +255 | 32 | 0.8% | 1.6% |
| DenmarkDenmark | 3,883 | 4,020 | −3.4% | −137 | 641 | 16.5% | 1.6% |
| SlovakiaSlovakia | 2,771 | 2,216 | +25.0% | +555 | 16 | 0.6% | 1.1% |
| BulgariaBulgaria | 2,391 | 2,537 | −5.8% | −146 | 2 | 0.1% | 1.0% |
| IrelandIreland | 2,381 | 2,405 | −1.0% | −24 | 4 | 0.2% | 1.0% |
| FinlandFinland | 2,219 | 2,227 | −0.4% | −8 | 63 | 2.8% | 0.9% |
| Slovenia Slovenia | 1,862 | 1,667 | +11.7% | +195 | 3 | 0.2% | 0.8% |
| CroatiaCroatia | 1,477 | 1,355 | +9.0% | +122 | 7 | 0.5% | 0.6% |
| LatviaLatvia | 1,085 | 919 | +18.1% | +166 | 2 | 0.2% | 0.4% |
| LuxembourgLuxembourg | 895 | 847 | +5.7% | +48 | 17 | 1.9% | 0.4% |
| GreeceGreece | 590 | 475 | +24.2% | +115 | 101 | 17.1% | 0.2% |
| EstoniaEstonia | 565 | 554 | +2.0% | +11 | 1 | 0.2% | 0.2% |
| CyprusCyprus | 151 | 130 | +16.2% | +21 | 0 | 0.0% | 0.1% |
| MaltaMalta | 60 | 75 | −20.0% | −15 | 1 | 1.7% | 0.0% |
| EU-27 | 245,079 | 227,913 | +7.5% | +17,166 | 12,873 | 5.3% | 100% |
"2026" and "2025" are both cumulative 1–9 figures; YoY changes as published by ACEA; rechargeable share = rechargeable trucks ÷ new truck registrations.
Methodology and sources
- Scope. EU-27; trucks = medium and heavy trucks over 3.5 t; rechargeable = BEV + PHEV.
- Period. Cumulative months 1–9 of 2026, compared with the same period of 2025.
- Source. ACEA press release (published 2026-10-28), original PDF table. We only compile and convert; original figures are not adjusted.
- Citation. Please credit "Source: ACEA, compiled by AutoMusic" and state the reporting period.
Download and embed
You can use this chart on your own website, blog or report: copy the code below and the chart will appear together with a source link. The data updates along with this page.