TRATON nine-month orders up 25%, sales up 3%
In the first nine months of 2026, TRATON Group booked orders for 253147 units, up 25% year on year; sales reached 230436 units, up 3% year on year.
From Jan 2026 to Sep 2026, TRATON Group order intake totaled 253147 units, up 25% from 202111 units a year earlier; unit sales totaled 230436, up 3% from 224515 a year earlier.
By vehicle type, truck orders were 206861 units, up 28% year on year, with sales of 182815 units, up 4%. Bus orders were 22016 units, up 11%, with sales of 24211 units, down 5%. MAN TGE van orders were 24270 units, up 18%, with sales of 23410 units, up 3%. The order-to-sales ratio was 1.1, versus 0.9 a year earlier. Battery-electric truck sales were 1389 units, versus 646 a year earlier; battery-electric bus sales were 1283 units, versus 1387.
TRATON Group sales revenue was EUR 33,322 million, up 3% year on year from EUR 32,322 million. Operating profit was EUR 1,725 million, compared with EUR 1,723 million a year earlier. Adjusted operating profit was EUR 2,311 million, up 13% from EUR 2,039 million. The adjusted return on sales was 6.9%, up from 6.3%, calculated against group sales revenue.
TRATON kept its full-year outlook: 2026 unit sales and sales revenue are expected to change by between 0 and +7%. Group adjusted return on sales is expected at 6.3% to 7.3%, and TRATON Operations at 7.1% to 8.1%. TRATON said the forecast depends on geopolitical developments, especially the impact of US tariff policy and the Iran war.
Analytically, bus orders rose while sales fell; orders and sales are different metrics, so order growth cannot be taken as growth in deliveries for the period.
Scope: TRATON Group; Jan–Sep 2026; trucks, buses, MAN TGE VAN. Metrics: orders, sales (units), sales revenue, operating profit, adjusted operating profit (EUR million), adjusted return on sales.
Reading notes: TRATON published its nine-month results press release on 2026-10-28. All year-on-year comparisons are against Jan 2025 through month 9. Orders are new orders received; sales are vehicles sold in the same period. The two are not interchangeable. Operating profit and return on sales are also reported on an adjusted basis, and the two bases should not be mixed. The full-year outlook is TRATON's forecast, not an actual result.
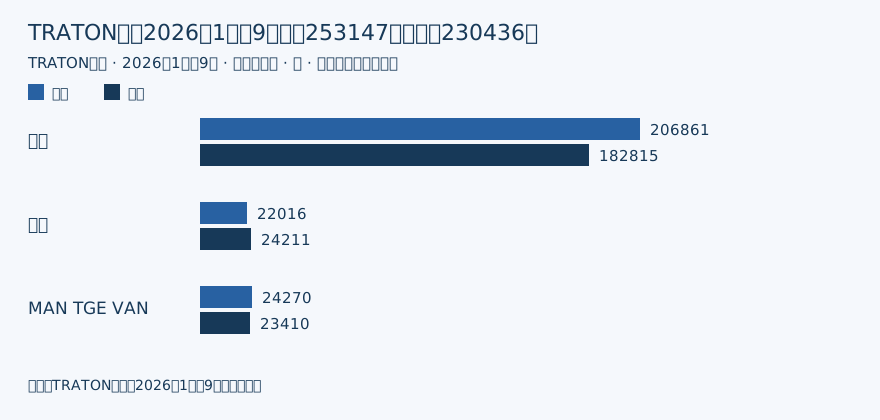
TRATON Group orders and sales by vehicle type, Jan 2026 to month 9. Source: TRATON; period: Jan 2026 to month 9; chart by AutoMusic.
| Metric | Jan 2026 to month 9 | Jan 2025 to month 9 | Change |
|---|---|---|---|
| Total orders (units) | 253147 | 202111 | +25% |
| Truck orders (units) | 206861 | 161817 | +28% |
| Bus orders (units) | 22016 | 19779 | +11% |
| MAN TGE van orders (units) | 24270 | 20515 | +18% |
| Total sales (units) | 230436 | 224515 | +3% |
| Truck sales (units) | 182815 | 176237 | +4% |
| Bus sales (units) | 24211 | 25551 | −5% |
| MAN TGE van sales (units) | 23410 | 22727 | +3% |
| Revenue (EUR million) | 33322 | 32322 | +3% |
| Operating profit (EUR million) | 1725 | 1723 | Up EUR 2 million |
| Adjusted operating profit (EUR million) | 2311 | 2039 | Up EUR 272 million |
| Adjusted return on sales | 6.9% | 6.3% | Up 0.6 percentage points |
Source: TRATON. TRATON GROUP increases unit sales, sales revenue, and adjusted operating result in the first nine months of 2026.