TRATON Q3 sales reach 78900 units, up 10% year on year
In Q3 2026, TRATON Group sold 78900 units, up 10% from 71400 units in the same period last year.
In Q3 2026, TRATON Group sold 78900 vehicles, up 10% from 71400 units in Q3 2025, according to preliminary figures. TRATON said the growth came mainly from markedly stronger demand from US customers; group sales rose 4% in Q2 2026.
By brand, International Motors sold 19900 units in the third quarter, versus 13400 a year earlier, up 48% year on year; TRATON said customer demand in the US market has recently recovered strongly. Scania Vehicles & Services sold 22100 units, versus 21500 a year earlier, up 3% year on year, which TRATON attributed mainly to the ramp-up of its new plant in Rugao, China, and Brazil's government-backed "Move Brasil" loan programme. MAN Truck & Bus sold 24500 units, versus 24600 a year earlier, down 1% year on year; its truck business improved while its bus and van businesses declined. Volkswagen Truck & Bus sold 12500 units, versus 11900 a year earlier, up 5% year on year, also boosted by the Brazilian loan programme.
The group's Q3 BEV sales were 770 units, versus 820 a year earlier, −6% year on year.
Separately, for Jan 2026 through month 9: group sales of 230400 units vs 224500 a year earlier, up 3%; BEVs 2670 units vs 2070 a year earlier, up 29%. This is a different time window from Q3.
Analysis: the quarterly increase came mainly from the North American brands, while the two European brands were mixed; full-year trends for each brand cannot be inferred from this.
Scope: TRATON Group and its four brands; Q3 2026, with Jan 2026 through month 9 shown separately; trucks, buses, VANs. Metrics: unit sales, of which BEV sales, YoY change.
Notes: TRATON published its third-quarter sales press release on 2026-10-12. Figures are preliminary; unit numbers in the table are rounded, while year-on-year changes are calculated from unrounded figures, so recalculating from the table may give slightly different results. The year-on-year base is sales in the comparison period: Q3 2025 for the quarterly comparison, and January to month 9 of 2025 for the nine-month comparison. BEVs for each brand are listed separately according to TRATON's definition and are included in brand sales. TRATON said it will publish its nine-month interim report on 2026-10-28.
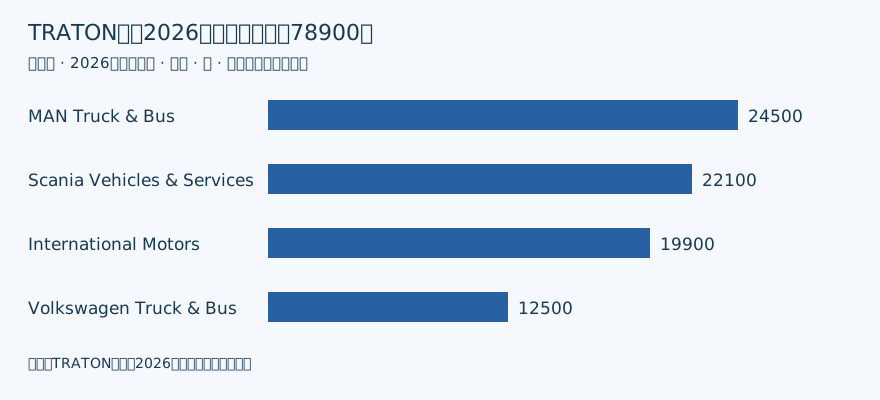
TRATON Group sales by brand, Q3 2026. Source: TRATON; period: Q3 2026; chart by AutoMusic.
| Entity | Q3 2026 (units) | Q3 2025 (units) | YoY | Jan 2026 to month 9 (units) | Jan 2025 to month 9 (units) | YoY |
|---|---|---|---|---|---|---|
| TRATON Group | 78900 | 71400 | +10% | 230400 | 224500 | +3% |
| Of which BEVs | 770 | 820 | −6% | 2670 | 2070 | +29% |
| Scania Vehicles & Services | 22100 | 21500 | +3% | 69300 | 68400 | +1% |
| Of which BEVs | 250 | 160 | +55% | 640 | 380 | +69% |
| MAN Truck & Bus | 24500 | 24600 | −1% | 75400 | 71700 | +5% |
| Of which BEVs | 380 | 290 | +32% | 1480 | 1090 | +36% |
| International Motors | 19900 | 13400 | +48% | 49400 | 48000 | +3% |
| Of which BEVs | 100 | 360 | −72% | 490 | 540 | −8% |
| Volkswagen Truck & Bus | 12500 | 11900 | +5% | 36300 | 36700 | −1% |
| Of which BEVs | 40 | 10 | +375% | 60 | 60 | +7% |
Source: TRATON. TRATON GROUP increases third quarter 2026 unit sales by 10% to 78,900 vehicles driven by strong US business.