Spain's vehicle exports in 1–9: 1427473 units, down 2.3% year on year
In the first 9 months of 2026, Spain exported 1427473 domestically produced vehicles, −2.3% year on year; output was 1675092 units, −1.6% year on year.

From Jan 2026 through month 9, Spain produced 1675092 vehicles, down 1.6% year on year; exports over the same period were 1427473 units, down 2.3%.
ANFAC said the EU took 58.4% of Spain's vehicle exports, a share 0.3 percentage points higher than a year earlier, with Italy's share up 1.4 percentage points. In the chart, the 58.4% figure is labelled UE-14; the UE-27 share is 67.0%, up 1.1 percentage points. The two EU definitions cover different countries and are not interchangeable. Continental Europe as a whole accounted for 92.2%, down 0.5 percentage points; this total includes Russia, Turkey and Israel.
The top 5 destinations together took 69.3% of exports. Italy's share rose by 1.4 percentage points and Germany's by 0.2 points, while France fell by 1.8 points, Türkiye by 1.5 points and the UK by 0.4 points. The top 10 destinations together accounted for 80%, down 1.4 percentage points.
By export volume year on year, Poland grew 22.3%, which ANFAC says makes it the sixth-largest export market; Italy grew 11.4%. Among the top 10 destinations, Turkey fell 15.6%, France 12.4% and Belgium 11.4%. Outside Europe, export share rose 0.4 percentage points in Africa and 0.2 points in the Americas, was flat in Oceania and fell 0.1 points in Asia.
Analysis: exports fell more sharply than production; Italy's share rose and exports to Poland grew, while the shares of France and Turkey declined. This does not allow conclusions about local sales trends in each destination market.
Scope: vehicles produced in Spain; cumulative Jan–9 2026, as of Sep 2026; all vehicles, with no split between passenger cars and commercial vehicles. Metrics: production, exports (units), year-on-year change, and share of export destinations and change in share (percentage points).
Reading notes: Published by ANFAC on 2026-10-21. Year-on-year and share changes are compared against Jan 2025 through month 9. Exports refer to vehicles produced in Spanish plants and exported, not registrations or sales in destination countries. All shares are calculated against total exports of 1427473 units in the period. EU share is given on both a UE-14 and a UE-27 basis; the EU 58.4% cited by ANFAC corresponds to UE-14.
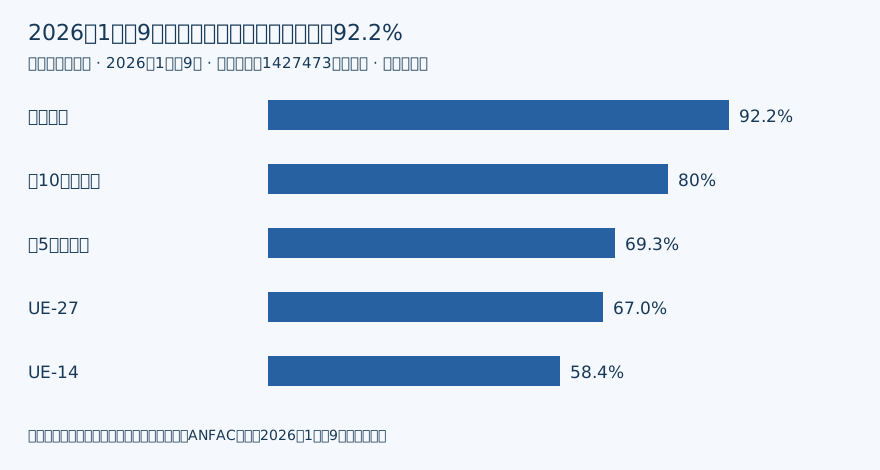
Destination shares of vehicles produced in Spain and exported, Jan 2026 through month 9. Denominator is total exports of 1427473 units; groups overlap. Source: ANFAC; period Jan 2026 through month 9; chart by AutoMusic.
| Destination group | Share of exports | vs. Jan 2025 to 9 |
|---|---|---|
| Continental Europe (incl. Russia, Turkey and Israel) | 92.2% | −0.5 percentage points |
| Top 10 destinations | 80% | −1.4 percentage points |
| Top 5 destinations | 69.3% | Not disclosed |
| UE-27 | 67.0% | +1.1 percentage points |
| UE-14 | 58.4% | +0.3 percentage points |
| Destination | Exports YoY | Share change |
|---|---|---|
| Poland | +22.3% | Not disclosed |
| Italy | +11.4% | +1.4 percentage points |
| Germany | Not disclosed | +0.2 percentage points |
| United Kingdom | Not disclosed | −0.4 percentage points |
| Belgium | −11.4% | Not disclosed |
| France | −12.4% | −1.8 percentage points |
| Turkey | −15.6% | −1.5 percentage points |
Source: ANFAC. Diversificación de la exportación española de vehículos, Tercer trimestre de 2026.