Data chart dashboard: BYD vs European automakers
BYD vs European automakers * { margin: 0; padding: 0; box-sizing: border-box; } body { font-family: ‘Microsoft YaHei’, ‘PingFang SC’, -apple-system, sans-serif; background: linear-gradient(135deg, #667eea 0%, #764ba2 100%); padding: 40px 20px; color: #333; } .container { max-width: 1200px; margin: 0 auto; background: white; border-radius: 20px; box-shadow: 0 20px 60px rgba(0,0,0,0.3); overflow: hidden; } .header { background: linear-gradient(135deg, #1e3c72 0%, #2a5298 100%); color: white; padding: 50px 40px; text-align: center; } .header h1 { font-size: 42px; margin-bottom: 15px; font-weight: bold; } .header p { font-size: 18px; opacity: 0.9; } .content { padding: 50px 40px; } .section { margin-bottom: 60px; } .section-title { font-size: 28px; color: #1e3c72; margin-bottom: 30px; padding-bottom: 15px; border-bottom: 3px solid #667eea; font-weight: bold; } /* Sales comparison bar chart */ .sales-comparison { display: grid; gap: 25px; } .brand-bar { position: relative; } .brand-info { display: flex; justify-content: space-between; align-items: center; margin-bottom: 10px; font-weight: 600; } .brand-name { font-size: 18px; display: flex; align-items: center; gap: 10px; } .brand-sales { font-size: 20px; color: #667eea; } .bar-container { height: 50px; background: #f0f0f0; border-radius: 25px; overflow: hidden; position: relative; } .bar-fill { height: 100%; background: linear-gradient(90deg, #667eea 0%, #764ba2 100%); border-radius: 25px; display: flex; align-items: center; justify-content: flex-end; padding-right: 20px; color: white; font-weight: bold; transition: width 2s ease-out; } .bar-fill.byd { background: linear-gradient(90deg, #f12711 0%, #f5af19 100%); } .bar-fill.vw { background: linear-gradient(90deg, #1e3c72 0%, #2a5298 100%); } .bar-fill.volvo { background: linear-gradient(90deg, #0f2027 0%, #203a43 100%); } .bar-fill.mercedes { background: linear-gradient(90deg, #43cea2 0%, #185a9d 100%); } /* Growth rate comparison */ .growth-cards { display: grid; grid-template-columns: repeat(auto-fit, minmax(250px, 1fr)); gap: 25px; } .growth-card { background: linear-gradient(135deg, #f5f7fa 0%, #c3cfe2 100%); padding: 30px; border-radius: 15px; text-align: center; box-shadow: 0 5px 15px rgba(0,0,0,0.1); transition: transform 0.3s; } .growth-card:hover { transform: translateY(-10px); } .growth-card.highlight { background: linear-gradient(135deg, #f12711 0%, #f5af19 100%); color: white; } .growth-card h3 { font-size: 20px; margin-bottom: 15px; } .growth-number { font-size: 48px; font-weight: bold; margin: 15px 0; } .growth-label { font-size: 14px; opacity: 0.8; } /* Market share pie chart */ .market-share { display: grid; grid-template-columns: 1fr 1fr; gap: 40px; align-items: center; } .pie-chart { position: relative; width: 300px; height: 300px; margin: 0 auto; } .pie-chart svg { transform: rotate(-90deg); } .share-legend { display: grid; gap: 15px; } .legend-item { display: flex; align-items: center; gap: 15px; padding: 15px; background: #f8f9fa; border-radius: 10px; } .legend-color { width: 40px; height: 40px; border-radius: 8px; flex-shrink: 0; } .legend-info { flex: 1; } .legend-name { font-weight: 600; font-size: 16px; margin-bottom: 5px; } .legend-percent { font-size: 24px; font-weight: bold; color: #667eea; } /* Pricing comparison */ .pricing-comparison { display: grid; grid-template-columns: repeat(auto-fit, minmax(200px, 1fr)); gap: 20px; } .price-card { background: white; border: 2px solid #e0e0e0; border-radius: 15px; padding: 25px; text-align: center; transition: all 0.3s; } .price-card:hover { border-color: #667eea; box-shadow: 0 10px 30px rgba(102, 126, 234, 0.2); } .price-card.best-value { background: linear-gradient(135deg, #f12711 0%, #f5af19 100%); color: white; border: none; } .car-model { font-size: 18px; font-weight: bold; margin-bottom: 20px; } .price { font-size: 36px; font-weight: bold; margin: 15px 0; } .price-label { font-size: 14px; opacity: 0.7; } /* Key data */ .key-stats { display: grid; grid-template-columns: repeat(auto-fit, minmax(200px, 1fr)); gap: 25px; margin-top: 30px; } .stat-box { background: linear-gradient(135deg, #667eea 0%, #764ba2 100%); color: white; padding: 30px; border-radius: 15px; text-align: center; } .stat-number { font-size: 42px; font-weight: bold; margin-bottom: 10px; } .stat-label { font-size: 14px; opacity: 0.9; } /* Responsive */ @media (max-width: 768px) { .header h1 { font-size: 32px; } .market-share { grid-template-columns: 1fr; } .pie-chart { width: 250px; height: 250px; } } .footer { background: #f8f9fa; padding: 30px 40px; text-align: center; color: #666; font-size: 14px; } .emoji { font-style: normal; }
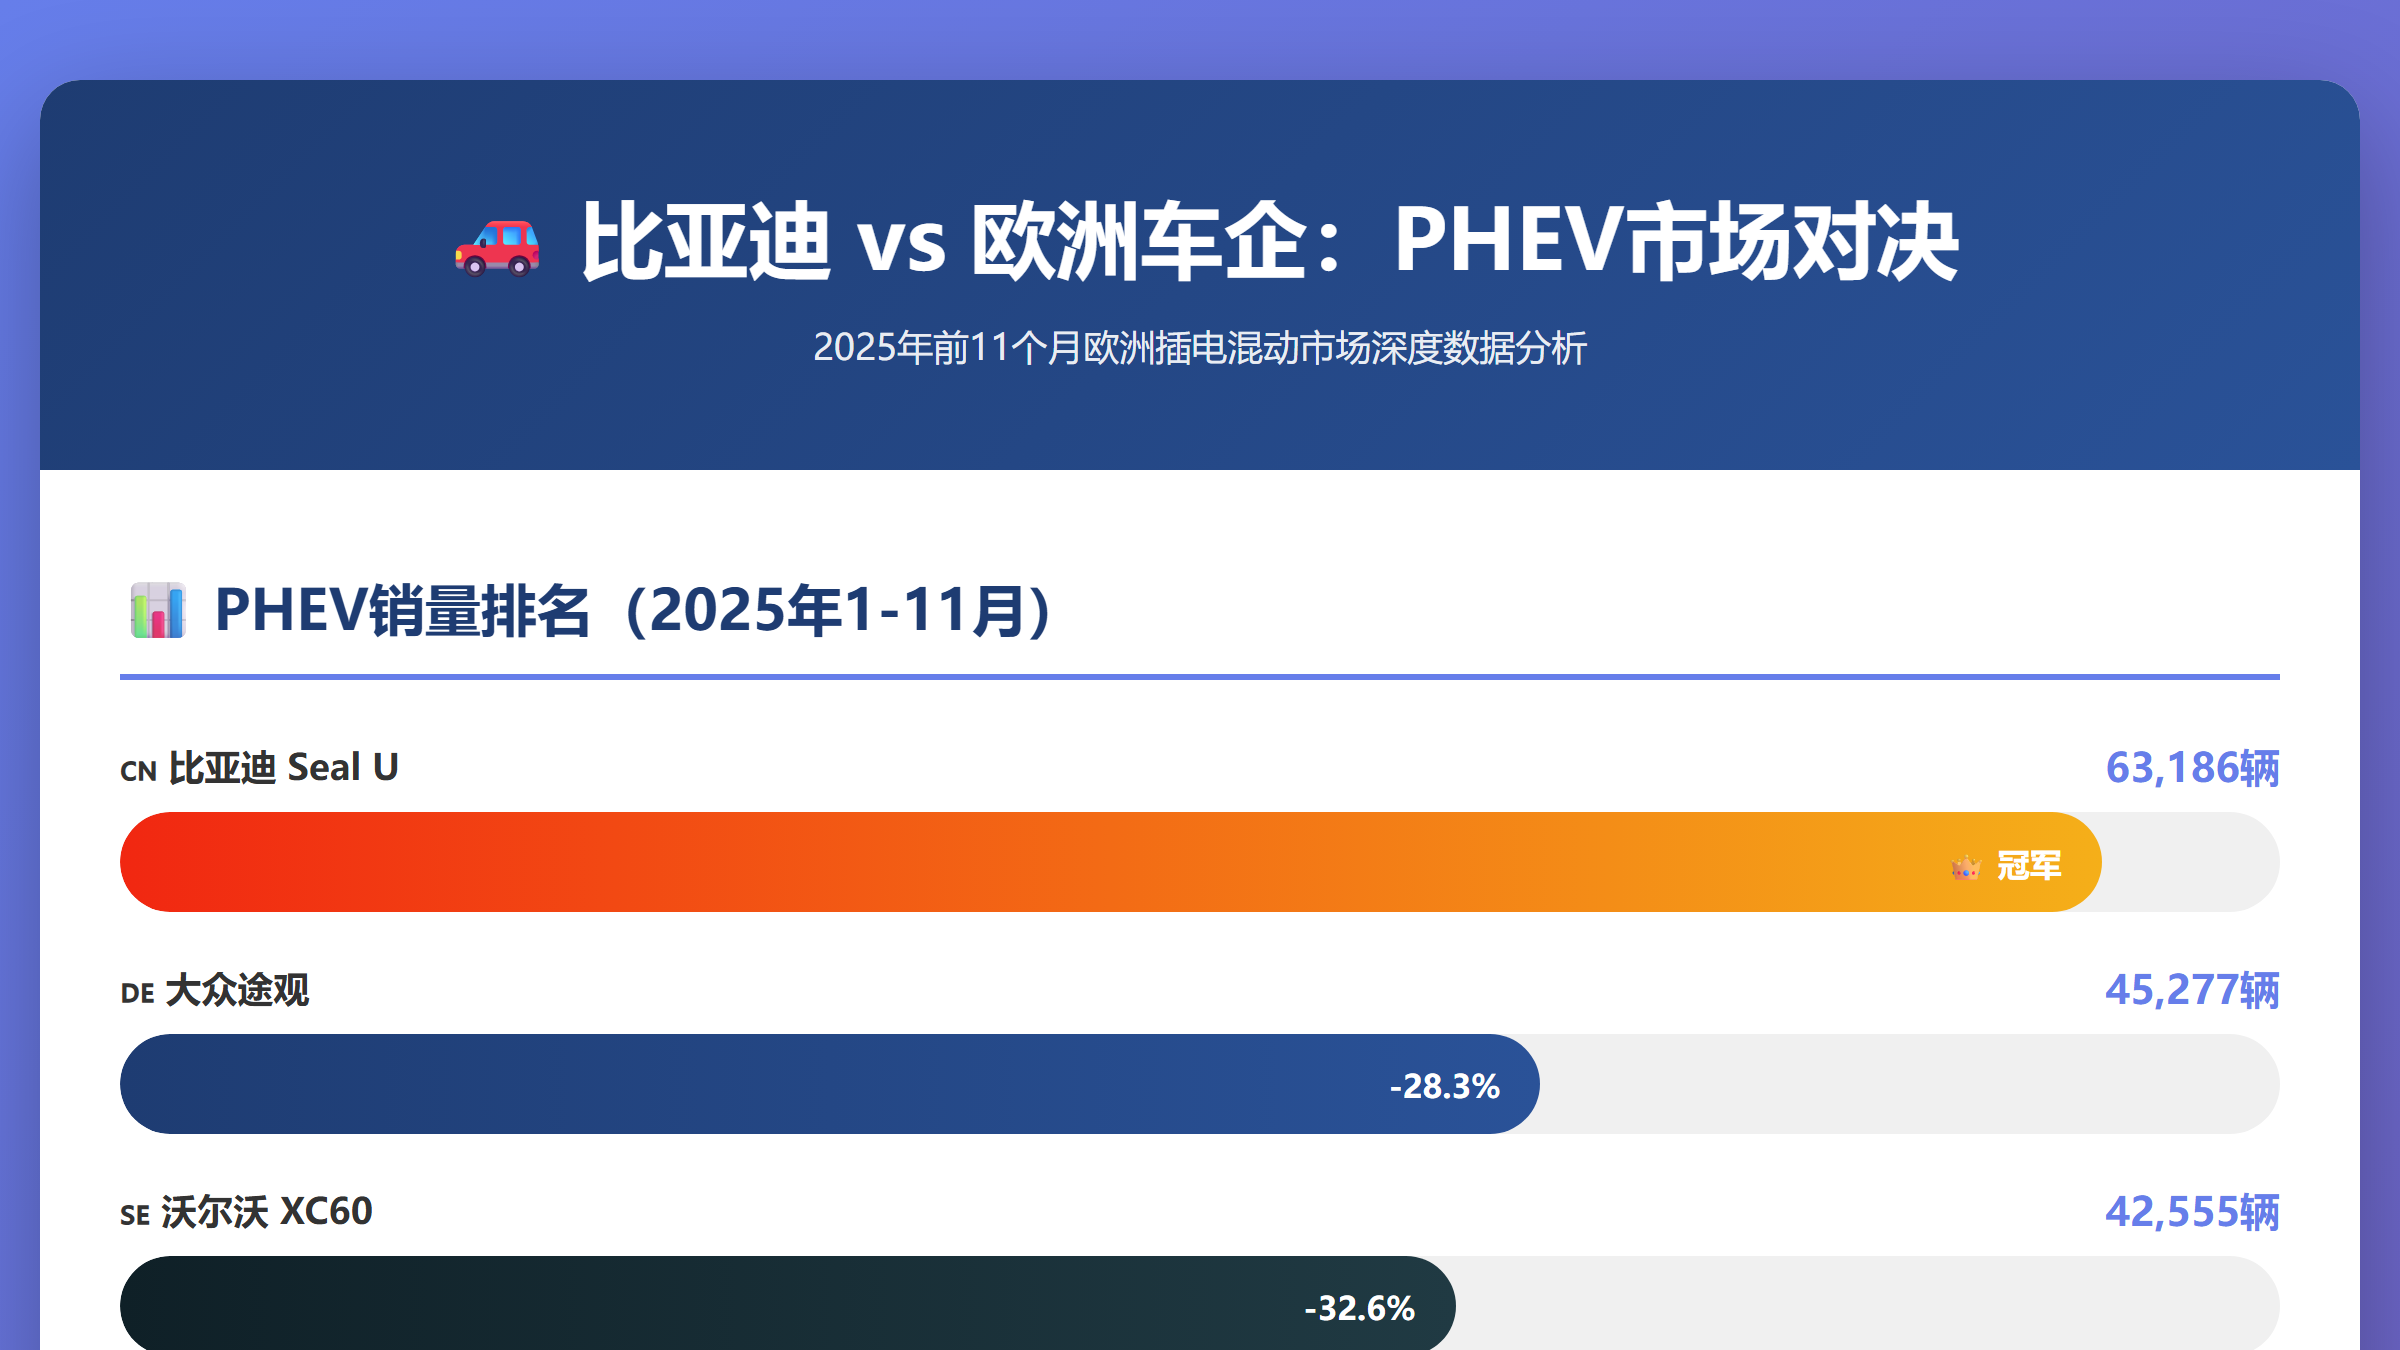
🚗 BYD vs European automakers: the PHEV showdown
In-depth data analysis of the European PHEV market, first 11 months of 2025
📊 PHEV sales ranking (1–11 2025)
🇨🇳 BYD Seal U: 63,186 units
👑 Leader
🇩🇪 Volkswagen Tiguan: 45,277 units
-28.3%
🇸🇪 Volvo XC60: 42,555 units
-32.6%
🇩🇪 Mercedes-Benz GLC 25,847 units
-59.1%
📈 YoY growth comparison (2025 vs 2024)
🇨🇳 BYD
+302.6%
Overall growth in the first three quarters
🇩🇪 Volkswagen
+104.6%
But overtaken by PHEVs
🇩🇪 Mercedes-Benz
-0.6%
Stalled
🇸🇪 Volvo
-17.3%
Sharp decline
🇺🇸 Tesla
-29.2%
Market share halved
🇩🇪 Audi
+14.2%
Moderate growth
🥧 European NEV market share (first three quarters)
🇩🇪 Volkswagen
11.2%
🇩🇪 BMW
9.0%
🇩🇪 Mercedes-Benz
6.8%
🇨🇳 BYD
4.4%
Other brands
68.6%
💰 PHEV starting prices in Germany compared
BYD Seal U
€39,990
🏆 Best value
Volkswagen Tiguan PHEV
€47,565
Traditional mainstream
Volvo XC60
€52,900
Nordic luxury
Mercedes-Benz GLC
€58,400
German luxury
Audi Q5 PHEV
€55,000
Tech luxury
🔑 Key market data
+31.5%
European PHEV market growth
(first 9 months of 2025)
+55.7%
PHEV monthly growth in month 9
(highest in 2021 years)
16:1
Europe's EV-to-charger ratio
(far lower than China's 3:1)
150,000 units
BYD Turkey plant
annual capacity (production from 2026)
Source: Autovista24, EV Volumes, Automotive News Europe | Data for months 1–11 of 2025
📊 BYD reshapes Europe's PHEV market with technology innovation and price advantage
// Animation effects window.addEventListener(‘load’, function() { // Bar chart animation const bars = document.querySelectorAll(‘.bar-fill’); bars.forEach(bar => { setTimeout(() => { bar.style.width = bar.getAttribute(‘data-width’); }, 300); }); // Scroll animation const observerOptions = { threshold: 0.2, rootMargin: ‘0px 0px -100px 0px’ }; const observer = new IntersectionObserver((entries) => { entries.forEach(entry => { if (entry.isIntersecting) { entry.target.style.opacity = ‘1’; entry.target.style.transform = ‘translateY(0)’; } }); }, observerOptions); document.querySelectorAll(‘.section’).forEach(section => { section.style.opacity = ‘0’; section.style.transform = ‘translateY(30px)’; section.style.transition = ‘all 0.6s ease-out’; observer.observe(section); }); });